OVERVIEW
The global floating power plant market is expected to hit USD 1.85 billion by 2024, rising at CAGR by 9.4% from 2019 to 2024. Factors driving the market include the demand for power, coupled with a lack of power infrastructure, benefits from land-based power plants, and requirements for energy efficiency and the need for clean energy (renewable energy).


TABLE OF CONTENT
1 Global Floating Power Plant Market – Overview
1.1 StudyObjectives
1.2 MarketDefinition
1.3 Study Scope
1.3.1 MarketsCovered
1.3.2 GeographicScope
2 RESEARCHMETHODOLOGY
2.1 ResearchData
2.1.1 SecondaryData
2.1.1.1 Key Data From SecondarySources
2.1.2 PrimaryData
2.1.2.1 Key Data From PrimarySources
2.1.2.2 Key IndustryInsights
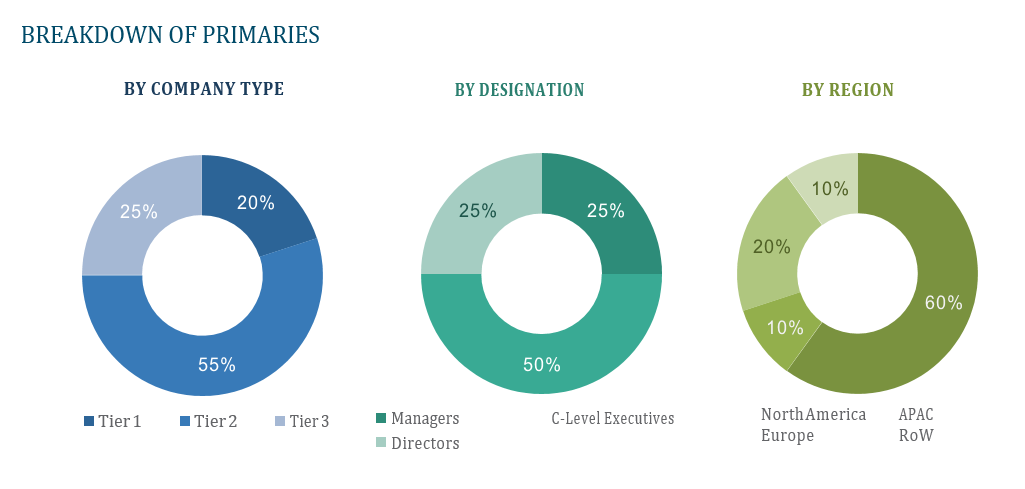
2.1.2.3 Breakdown ofPrimaries
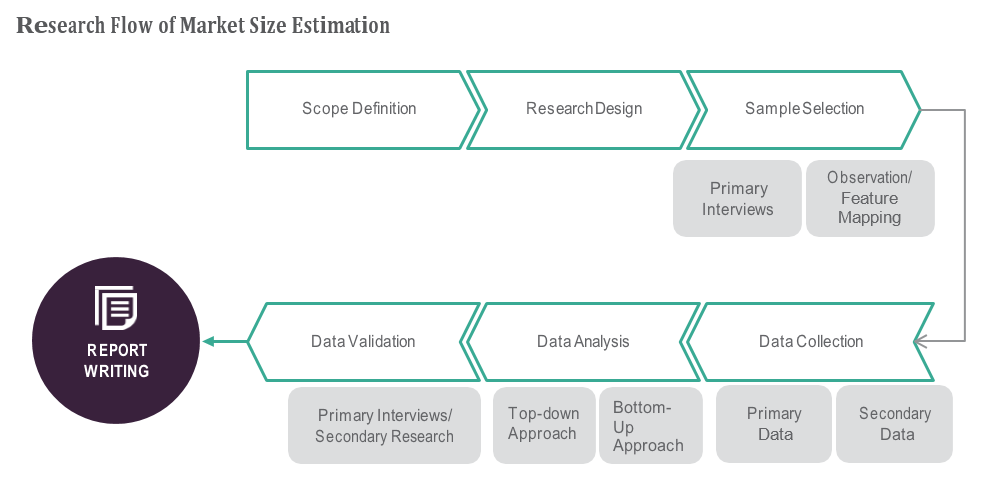
2.2 Market SizeEstimation
2.2.1 Bottom-UpApproach
2.2.2 Top-DownApproach
2.3 Market Breakdown and Data Triangulation
2.4 ResearchAssumptions
3 Global Floating Power Plant Market – Executive Summary
3.1 Market Revenue, Market Size and Key Trends by Company
3.2 Key Trends by type of Application
3.3 Key Trends segmented by Geography
4 Global Floating Power Plant Market – Comparative Analysis
4.1 Product Benchmarking – Top 10 companies
4.2 Top 5 Financials Analysis
4.3 Market Value split by Top 10 companies
4.4 Patent Analysis – Top 10 companies
4.5 Pricing Analysis
5 Global Floating Power Plant Market – Industry Market Entry Scenario
5.1 Regulatory Framework Overview
5.2 New Business and Ease of Doing business index
5.3 Case studies of successful ventures
5.4 Customer Analysis – Top 10 companies
6 Global Floating Power Plant Market – MarketForces
6.1 Introduction
6.2 Market Dynamics
6.2.1 Drivers
6.2.2 Opportunities
6.2.3 Challenges
6.3 Porters Analysis of Market
6.3.1 Bargaining power of suppliers
6.3.2 Bargaining powers of customers
6.3.3 Threat of new entrants
6.3.4 Rivalry among existing players
6.3.5 Threat of substitutes
7 Global Floating Power Plant Market – Strategic Analysis
7.1 Value Chain analysis
7.2 Product Life Cycle
7.3 Supplier and distributor analysis (Market share and product dealing strategies)
8 Global Floating Power Plant Market – By Power Source (Market Size – & million/billion)
8.1 Non-renewable
8.2 Renewable
8.3 Wind
9 Global Floating Power Plant Market – ByCapacity
9.1 1 MW–5 MW
9.2 5.1 MW–20 MW
9.3 20.1 MW–100 MW
9.4 100.1 MW–250 MW
9.5 Above 250 MW
10 Global Floating Power Plant Market – By Geography (Market Size – & million/billion)
10.1 Introduction
10.2 NorthAmerica
10.2.1 US
10.2.2 Canada
10.2.3 Mexico
10.3 Europe
10.3.1 U.K
10.3.2 Germany
10.3.3 Italy
10.3.4 France
10.3.5 Spain
10.3.6 Rest of Europe
10.4 Asia-Pacific
10.4.1 China
10.4.2 Japan
10.4.3 India
10.4.4 SouthKorea
10.4.5 Rest ofAPAC
10.5 Rest of the World
10.5.1 SouthAmerica
10.5.2 MiddleEast
10.5.3 Africa
11 Global Floating Power Plant Market – Entropy
11.1 New product launches
11.2 M&A’s, collaborations, JVs and partnerships
12 Global Floating Power Plant Market Company Profile (Key Players)
12.1 Market Share, Company Revenue, Products, M&A, Developments
12.2 General Electric Company
12.3 Siemens AG
12.4 Wärtsilä Corporation
12.5 Kyocera Corporation
12.6 Caterpillar Inc.
12.7 Mitsubishi Corporation
12.8 Yingli Green Energy Holding Company Limited
12.9 Vikram Solar Pvt. Ltd.
12.10 Principle Power, Inc.
12.11 MAN Diesel & Turbo SE
12.12 Company 11 & more
13 Global Floating Power Plant Market – Appendix
13.1 Sources
13.2 Abbreviations


